Home -> Law Blog Directory -> Bailout Blogs -> Calculated Risk
(866) 635-2689 for Personal Injury or (866) 635-9402 for Criminal Defense
Find a Local Lawyer
Divorce (866) 635-6190
Personal Injury (866) 635-2689
Criminal Defense (866) 635-9402

Bailout
: Calculated RiskImpact of estimated Benchmark Revision on Job Losses
By Anonymous
As part of the employment report, the BLS released the preliminary annual benchmark revision of minus 366,000 payroll jobs. This will be finalized next February when the January 2011 employment report is released. Usually the preliminary estimate is pretty close to the final benchmark estimate.
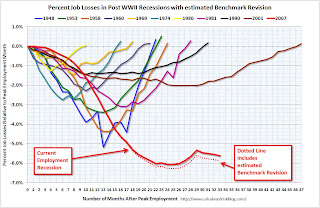 Click on graph for larger image.
This graph shows the impact of the preliminary benchmark revision on job losses in percentage terms from the start of the employment recession.
The red line on the graph is the current estimate, and the dotted line shows the impact of estimated coming benchmark revision. This puts the current payroll employment about 8.1 million jobs below the pre-recession peak in December 2007.
Using the preliminary benchmark estimate, this means that payroll employment in March 2010 was 366,000 lower than originally estimated. This is slightly larger than a normal adjustment (see table below). So in February 2011, the payroll numbers will be revised down to reflect this estimate. The number is then "wedged back" to the previous revision (March 2009).
For details on the benchmark revision process, see from the BLS: Methodology
"The benchmark adjustment, a standard part of the payroll survey estimation process, is a once-a-year re-anchoring of the sample-based employment estimates to full population counts available principally through unemployment insurance (UI) tax records filed by employers with State Employment Security Agencies."The following table shows the benchmark revisions since 1979.
| Year | Percent difference | Difference in thousands |
|---|---|---|
| 1979 | 0.5 | 447 |
| 1980 | -0.1 | -63 |
| 1981 | -0.4 | -349 |
| 1982 | -0.1 | -113 |
| 1983 | * | 36 |
| 1984 | 0.4 | 353 |
| 1985 | * | -3 |
| 1986 | -0.5 | -467 |
| 1987 | * | -35 |
| 1988 | -0.3 | -326 |
| 1989 | * | 47 |
| 1990 | -0.2 | -229 |
| 1991 | -0.6 | -640 |
| 1992 | -0.1 | -59 |
| 1993 | 0.2 | 263 |
| 1994 | 0.7 | 747 |
| 1995 | 0.5 | 542 |
| 1996 | * | 57 |
| 1997 | 0.4 | 431 |
| 1998 | * | 44 |
| 1999 | 0.2 | 258 |
| 2000 | 0.4 | 468 |
| 2001 | -0.1 | -123 |
| 2002 | -0.2 | -313 |
| 2003 | -0.2 | -122 |
| 2004 | 0.2 | 203 |
| 2005 | -0.1 | -158 |
| 2006 | 0.6 | 752 |
| 2007 | -0.2 | -293 |
| 2008 | -0.1 | -89 |
| 2009 | -0.7 | -902 |
| 2010 | -0.3 | -366 estimate |
Earlier employment posts today (with many graphs):

Full post as published by Calculated Risk on October 08, 2010 (boomark / email).
Mirrors
Recalled Due to Impact and Laceration Hazards
Unlicensed Software
Florida Benchmark agrees to pay $150,000 SIIA settlement.
Stock Market Losses
alleging bad financial advice and conflicts of interest.
Mutual Fund Losses
alleging financial advisors breached fiduciary duties by not looking out for investors best interests.
Bayer CropScience AG
alleging farmers suffered economic losses after Bayer's biotech Liberty Link rice was released into the food supply and countries banned US rice.

#1 Online Legal Resource

On 08-25 at 15:46PM
Acute perpendicular parking #NYPD #NYFD
On 08-18 at 22:18PM
Parallel parking gone bad. Too much gas UES NYC
On 08-18 at 21:41PM
UES NYC
On 08-18 at 21:25PM
Twitter suspends journalist critical of broadcast partner's coverage on dubious grounds @guyadams #nbcfail #twitterfail
On 07-30 at 17:57PM
Model example of 1st Amendment suppression by the People of New York City's Michael Bloomberg #OWS #NYPD
On 07-12 at 21:07PM
AG Holder lackadaisical on Operation in our Sites domain name seizures & RIAA lobbied free speech suppression @dajaz1
On 06-08 at 22:44PM
Why is the Catholic Church going to court over Obama contraception policy? @NewYorker commentary
On 05-31 at 10:08AM
Monks sue Louisiana for right to sell caskets made from forrest destroyed by Katrina
On 05-31 at 07:47AM
Are the abortion ultrasound laws headed for the Supreme Court?
On 05-15 at 21:52PM





Estimated GSE Losses = $448 Billion
Data on general counsel who participate in multiple benchmark studies
Kolmogorov-Smirnov test to see whether benchmark respondents are representative
Needed: independent audits of benchmark methodology, data, and basis for conclusions
Benchmark Litigation ranks lawyers





 |
|
Contact Us | About Us | Celebrity Law Blog |
Our Partners | Disclaimer
| Law Blog Directory
| Law Jobs
| Law Tweets
| Oil Spill Video
All original material © 1999-2011 by USLaw.com. All other material, including Blog Directory feed content, are © by their respective copyright holders. |