
Home -> Law Blog Directory -> Bailout Blogs -> Calculated Risk
(866) 635-2689 for Personal Injury or (866) 635-9402 for Criminal Defense
Find a Local Lawyer
Divorce (866) 635-6190
Personal Injury (866) 635-2689
Criminal Defense (866) 635-9402

Bailout
: Calculated RiskCase-Shiller House Price Graphs for January
By Anonymous

IMPORTANT: These graphs are Not Seasonally Adjusted (NSA). Unfortunately this month only the NSA data is currently available. Usually I report the SA data, but that isn't available.
S&P/Case-Shiller released the monthly Home Price Indices for January (actually a 3 month average).
The monthly data includes prices for 20 individual cities, and two composite indices (10 cities and 20 cities).
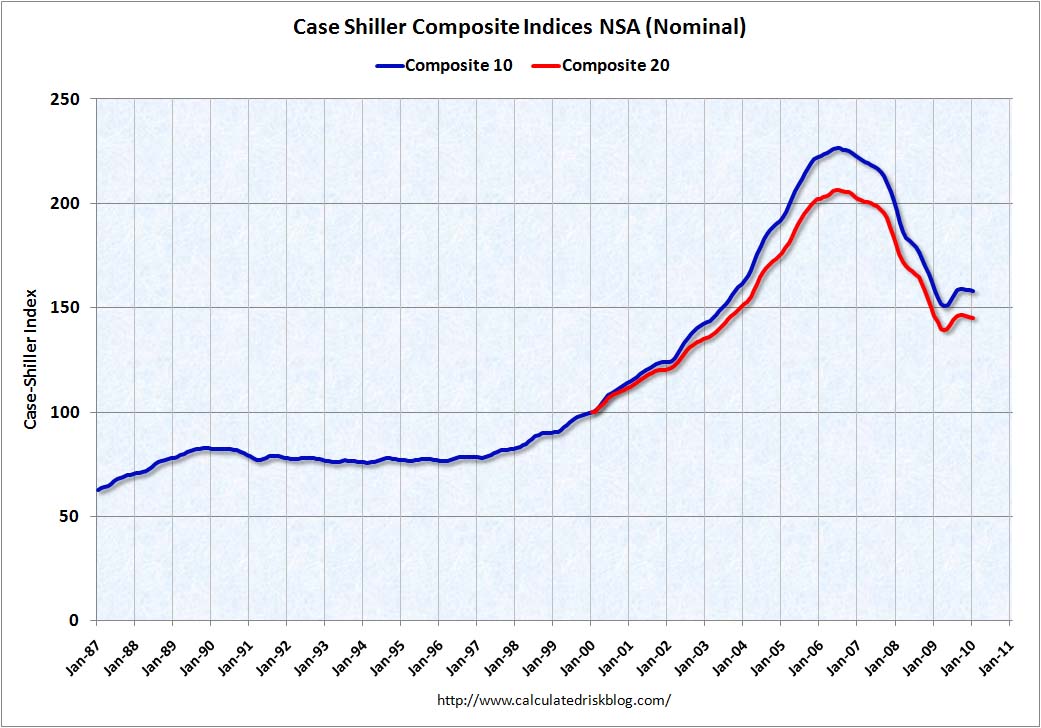 Click on graph for larger image in new window.
The first graph shows the nominal not seasonally adjusted Composite 10 and Composite 20 indices (the Composite 20 was started in January 2000).
The Composite 10 index is off 30.2% from the peak, and down about 0.2% in January (media reports are an increase seasonally adjusted - but that data isn't available).
The Composite 20 index is off 29.6% from the peak, and down about 0.4% in January (NSA).
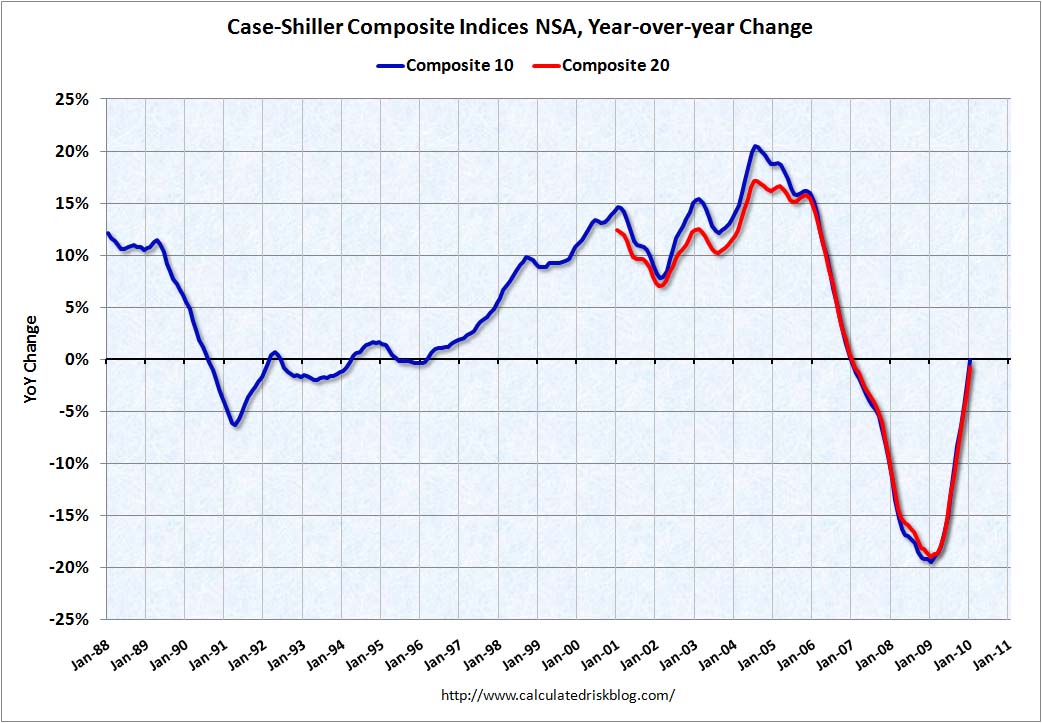 The second graph shows the Year over year change in both indices.
The Composite 10 is essentially flat compared to January 2009.
The Composite 20 is off 0.7% from January 2009.
The third graph shows the price declines from the peak for each city included in S&P/Case-Shiller indices.
 Prices decreased (NSA) in 18 of the 20 Case-Shiller cities in January NSA.
On a SA basis from the NY Times: U.S. Home Prices Prices Inch Up, but Troubles Remain
Twelve of the cities in the index went up in January from December. Los Angeles was the biggest gainer, up 1.7 percent. Chicago was the biggest loser, dropping 0.8 percent.NOTE: Usually I report the Seasonally Adjusted data (see NY Times article), but that data wasn't available. So remember these graphs are NSA.

Full post as published by Calculated Risk on March 30, 2010 (boomark / email).
House Closing
Sealing a home sale
School House Abuse
Selwyn House School agrees to $5 million teacher molestation settlement.
Nestle USA
Recalls Toll House Refrigerated Cookie Dough Products
Lighter Blamed in House Fire
Cricket Lighters settles $200,00 wrongful death lawsuit.
Pork BBQ Products Recalled
The U.S. Department of Agriculture's Food Safety and Inspection Service (FSIS) announced Oct 20 that the Murphy House in Louisburg, N...
Texas' KB Home Hit with Price Fixing Class Action
Texas' KB Home Faces Price Fixing Class-Action
KB Home Faces Price Fixing Class Action
KB Home Faces Price Fixing Class Action

#1 Online Legal Resource

On 08-25 at 15:46PM
Acute perpendicular parking #NYPD #NYFD
On 08-18 at 22:18PM
Parallel parking gone bad. Too much gas UES NYC
On 08-18 at 21:41PM
UES NYC
On 08-18 at 21:25PM
Twitter suspends journalist critical of broadcast partner's coverage on dubious grounds @guyadams #nbcfail #twitterfail
On 07-30 at 17:57PM
Model example of 1st Amendment suppression by the People of New York City's Michael Bloomberg #OWS #NYPD
On 07-12 at 21:07PM
AG Holder lackadaisical on Operation in our Sites domain name seizures & RIAA lobbied free speech suppression @dajaz1
On 06-08 at 22:44PM
Why is the Catholic Church going to court over Obama contraception policy? @NewYorker commentary
On 05-31 at 10:08AM
Monks sue Louisiana for right to sell caskets made from forrest destroyed by Katrina
On 05-31 at 07:47AM
Are the abortion ultrasound laws headed for the Supreme Court?
On 05-15 at 21:52PM





S&P/Case-Shiller Home Price Indices - Published July 28, 2009
US House Prices Gain Back 6.3% Since Trough: S&P/Case-Shiller
US Home Price Recovery Flattened Out in October, Case-Shiller Data Shows
Case-Shiller Home Prices Go Up and Down
Home-Price Declines in 20 U.S. Cities Eased in April
Home Prices Decline While Mortgage Debt Remains High: The Case For Principle Reduction.





 |
|
Contact Us | About Us | Celebrity Law Blog |
Our Partners | Disclaimer
| Law Blog Directory
| Law Jobs
| Law Tweets
| Oil Spill Video
All original material © 1999-2011 by USLaw.com. All other material, including Blog Directory feed content, are © by their respective copyright holders. |